
Unlock Real‑Time Business Dashboards with GPT‑4o’s Multimodal AI
Discover how to embed GPT‑4o’s vision and audio capabilities into Power BI, Tableau, and Grafana, turning raw data into live visual insights while keeping costs low.
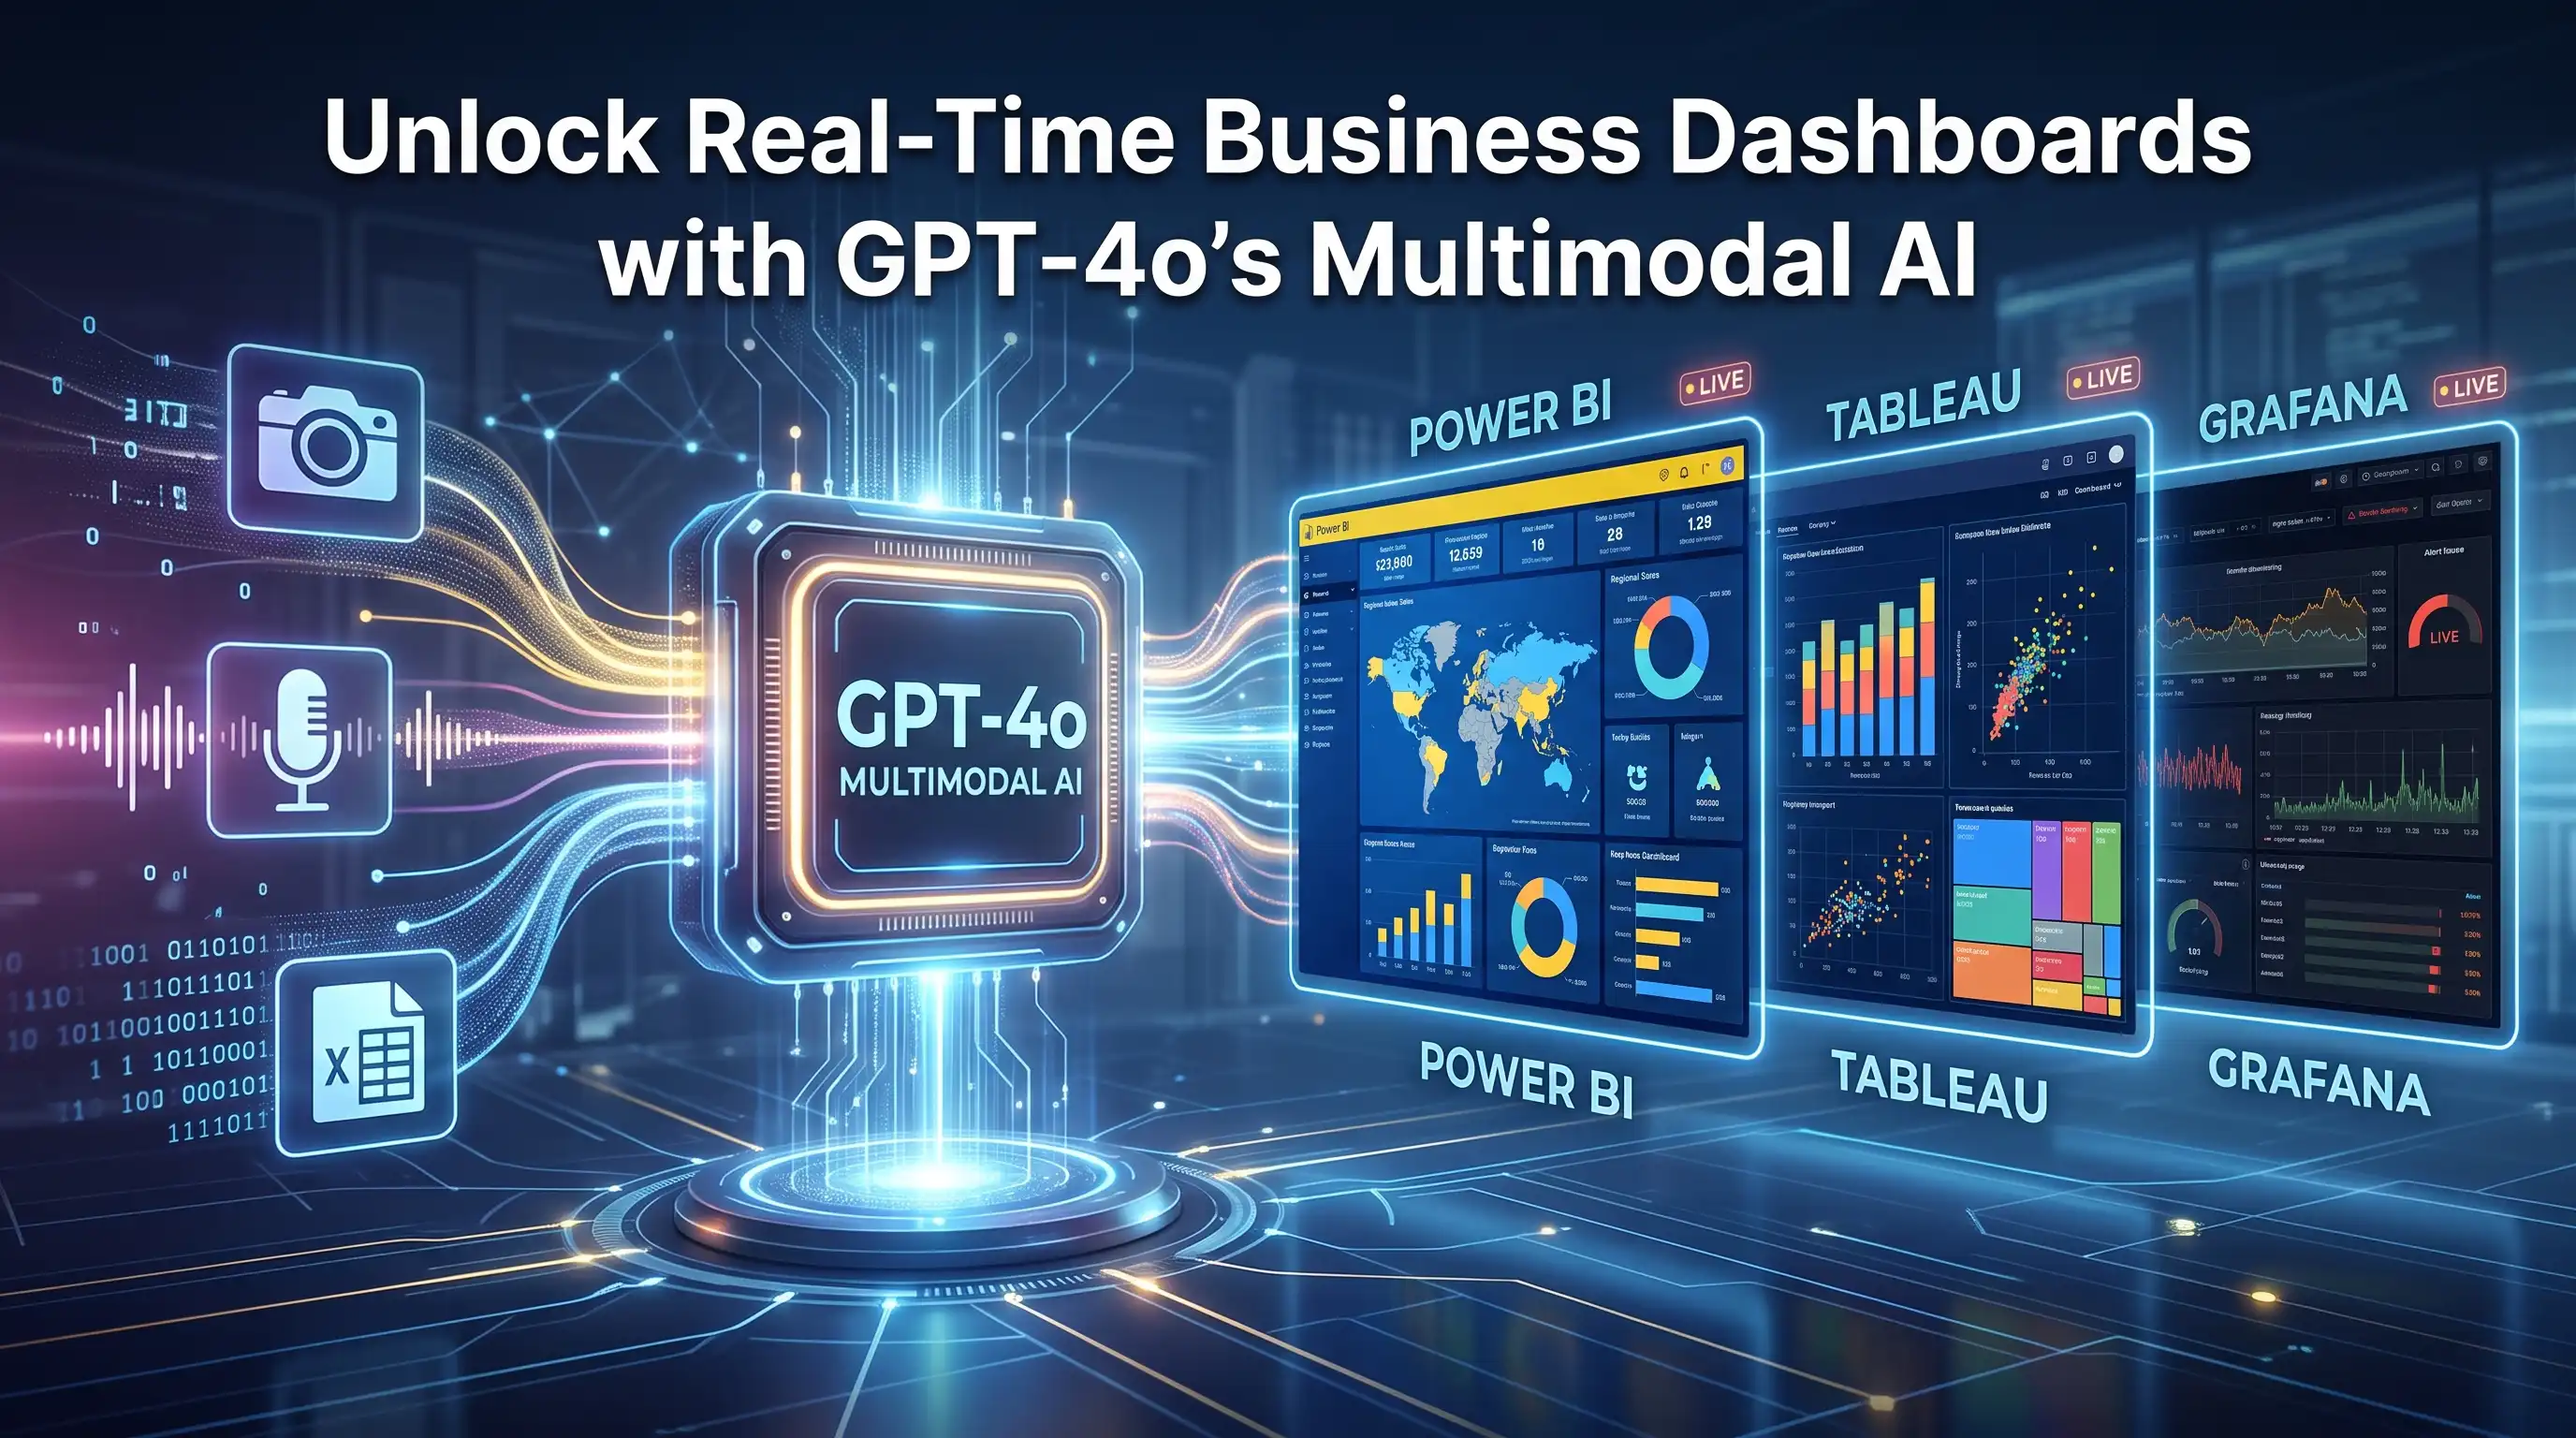
Why GPT‑4o Matters for Business Dashboards
When OpenAI released GPT‑4o last month, it added true multimodal perception—image, video, and audio input—while preserving the conversational strengths of its predecessor. For businesses that rely on dashboards, the ability to turn a data snapshot into a chart, map, or narrative with a single prompt is a game‑changer. Instead of manually configuring visual templates, analysts can ask the model to “show sales trends for the past quarter as a stacked bar chart with regional breakdown,” and receive a ready‑to‑use image or JSON spec. This reduces the time‑to‑insight, democratizes data storytelling, and opens the door to automated reporting pipelines that run on a pay‑as‑you‑go basis.
Getting Started: Prerequisites and API Access
OpenAI account and API keys
First, sign up for an OpenAI account and enable the GPT‑4o endpoint in the API dashboard. Generate a secret key and store it securely—environment variables or a secret‑manager service are recommended. The API follows the standard POST https://api.openai.com/v1/chat/completions pattern, with an additional model value of gpt-4o. For multimodal calls, include a multipart/form-data payload that carries image or audio files alongside the text prompt.
Choosing a dashboard platform
The integration steps differ slightly across tools, but the core pattern stays the same: (1) extract data from the platform, (2) send it to GPT‑4o with a well‑crafted prompt, (3) receive a visual representation, and (4) embed the result back into the dashboard. This guide covers three of the most popular choices—Power BI, Tableau, and Grafana—so you can pick the one that matches your stack.
Integrating GPT‑4o with Power BI
Step 1: Set up a custom connector
Power BI supports custom data connectors written in M (Power Query). Create a new connector that calls the OpenAI endpoint and returns a binary image. The skeleton looks like this:
section GPT4oConnector =
    let
        apiKey = EnvironmentVariable.Get("OPENAI_API_KEY"),
        url = "https://api.openai.com/v1/chat/completions",
        InvokeGPT = (prompt as text, image as binary) =>
            let
                body = [
                    model = "gpt-4o",
                    messages = [
                        [role = "user", content = [
                            [type = "text", text = prompt],
                            [type = "image_url", image_url = image]
                        ]]
                    ]
                ],
                options = [
                    Headers = ["Authorization" = "Bearer " & apiKey, "Content-Type" = "application/json"],
                    Content = Json.FromValue(body)
                ],
                response = Web.Contents(url, options),
                result = Json.Document(response)
            in
                result
    in
        InvokeGPT;
Save the file with a .pq extension and import it into Power BI Desktop. The connector now appears as a data source you can query like any other.
Step 2: Prompt design for visual generation
Effective prompts combine a clear instruction with a concise data sample. For example, if you have a table SalesData with columns Region, Quarter, and Revenue, you might extract the top five rows and embed them in the request:
let
    Source = SalesData,
    Sample = Table.FirstN(Source, 5),
    JsonSample = Json.FromValue(Sample),
    Prompt = "Create a stacked bar chart showing Revenue by Region for each Quarter. Use the data attached.",
    ImageResult = GPT4oConnector.InvokeGPT(Prompt, JsonSample)
in
    ImageResult
The API returns a base64‑encoded PNG that Power BI can render directly in a visual container.
Step 3: Automate refresh with Power Automate
To keep the visual up to date, schedule a Power Automate flow that triggers on a dataset refresh. The flow calls the same custom connector, stores the image in a OneDrive folder, and updates a Power BI “Image” visual that points to that file. This loop runs only when data changes, keeping costs low because you pay for GPT‑4o calls only on refresh events.
Integrating GPT‑4o with Tableau
Step 1: Use Tableau Extensions API
Tableau’s Extensions API lets you embed a web app inside a dashboard. Build a lightweight Node.js service that receives the current filter context, forwards it to GPT‑4o, and returns a chart image URL. The extension’s manifest (manifest.json) registers the service URL and declares the required permissions.
{
  "manifest_version": "1.0",
  "name": "GPT‑4o Visual Generator",
  "description": "Generates charts on the fly using GPT‑4o",
  "author": "Your Company",
  "api_version": "1.5",
  "permissions": ["data", "settings"],
  "url": "https://your‑service.example.com/extension.html"
}
When a user applies a filter, Tableau passes the filtered rows to the extension via tableau.extensions.dashboardContent.dashboard.getDataSourcesAsync(). Your service formats these rows as JSON, builds a prompt, and calls the OpenAI endpoint.
Step 2: Send data and receive chart images
The request payload mirrors the Power BI example but uses multipart form data to attach the JSON data as a file. The response includes a url field pointing to the generated PNG stored in a temporary cloud bucket (e.g., Azure Blob Storage). Return that URL to the extension, which then updates an <img> tag inside its iframe. Tableau treats the iframe as a native visual, so the user sees the AI‑generated chart seamlessly alongside other tiles.
Step 3: Embed images in a dashboard
Because the extension runs in the client’s browser, you can cache the image URL for the session to avoid duplicate API calls. Add a “Refresh AI Chart” button that re‑invokes the service only when the underlying data changes, further controlling costs.
Integrating GPT‑4o with Grafana (open‑source)
Step 1: Create a data source plugin
Grafana’s plugin architecture supports Go‑based back‑ends. Scaffold a new data source using the grafana-plugin-sdk-go template. The plugin’s QueryData method receives a time‑series query, extracts the numeric series, and calls GPT‑4o to produce a chart specification in JSON (for example, a Vega‑Lite spec).
func (ds *GPT4oDatasource) QueryData(ctx context.Context, req *datasource.QueryDataRequest) (*datasource.QueryDataResponse, error) {
    // 1. Convert Grafana query to a simple CSV string
    csv := convertToCSV(req.Queries)
    // 2. Build prompt
    prompt := fmt.Sprintf("Generate a Vega‑Lite spec for a line chart of the following data:\n%s", csv)
    // 3. Call OpenAI
    resp, err := callGPT4o(prompt, nil)
    if err != nil { return nil, err }
    // 4. Return spec as a JSON string that Grafana can render via the "json" panel
    return &datasource.QueryDataResponse{Responses: map[string]*datasource.QueryDataResponse{...}}, nil
}
The plugin registers a new panel type that interprets the returned JSON as a Vega‑Lite spec, rendering the chart directly in Grafana without external image files.
Step 2: Generate visualizations on the fly
Because Grafana refreshes panels every few seconds by default, you should throttle GPT‑4o calls. Implement a simple cache keyed by the query hash and a TTL of five minutes. This way, repeated refreshes during a monitoring session reuse the same AI‑generated spec, keeping the per‑month bill modest.
Cost‑Effective Automation Tips
- Batch prompts. Send a single request that contains multiple data slices and ask GPT‑4o to return an array of images. Fewer HTTP round‑trips mean lower token usage.
- Use low‑resolution outputs for previews. Request a smaller image size (e.g., 400 × 300) for dashboard tiles that are refreshed often, and upscale only when a user clicks for detail.
- Leverage the
max_tokensparameter. Limit the response length to the size needed for an image URL or a concise JSON spec. - Monitor usage. Set up OpenAI usage alerts in the dashboard to avoid surprise charges.
- Combine with native charting. Use GPT‑4o for complex “what‑if” visualizations while keeping standard KPI tiles native, balancing creativity and cost.
Best Practices for Production Deployments
- Secure API keys. Store them in vaults and never hard‑code them in client‑side scripts.
- Validate model output. Before rendering, check that the returned image meets size and format expectations; fall back to a placeholder on error.
- Version your prompts. Keep a repository of prompt templates so you can audit changes and reproduce results.
- Graceful degradation. If the OpenAI service is unavailable, display the last cached visual or a static fallback.
- Compliance. Ensure that any data sent to GPT‑4o complies with your organization’s data‑privacy policies; consider anonymizing sensitive fields.
Conclusion
GPT‑4o’s multimodal abilities turn static data pipelines into interactive storytelling engines. By wiring the model into Power BI, Tableau, or Grafana, businesses can automate chart creation, enrich reports with image‑based insights, and do so on a usage‑based budget. The steps outlined above—setting up API access, crafting prompts, embedding results, and adding cost controls—provide a repeatable framework you can adapt to any modern analytics stack. As more enterprises experiment with AI‑augmented dashboards, the early adopters who master these integrations will gain faster decision cycles and a clear competitive edge.
Can I use GPT‑4o for real‑time streaming data?
Yes, but you should batch updates and cache responses to stay within token limits and keep latency low.
Related posts
View allLeveraging GPT‑4 Turbo for Real‑Time Customer Support Automation
Discover a step‑by‑step guide to integrate OpenAI’s GPT‑4 Turbo into ticketing platforms, enabling fast, cost‑effective real‑time support while scaling smoothly as demand grows.
Building Multi‑Modal AI Assistants with OpenAI’s GPT‑4 Turbo: A Step‑by‑Step Guide
OpenAI’s GPT‑4 Turbo now supports images, enabling developers to craft multi‑modal AI assistants that boost productivity. Follow this practical guide to integrate vision, text, and tool use into your apps today.
Turbocharge Your Small Business with OpenAI’s GPT-4 Turbo API
Discover how small businesses can integrate OpenAI’s new GPT-4 Turbo API to automate routine tasks, cut costs, and boost productivity—step by step.
Comments (0)
Be the first to share feedback on this post.